7. Dashboards
Dashboards are the combination of graphs, queries, and filters to visualize information jointly.
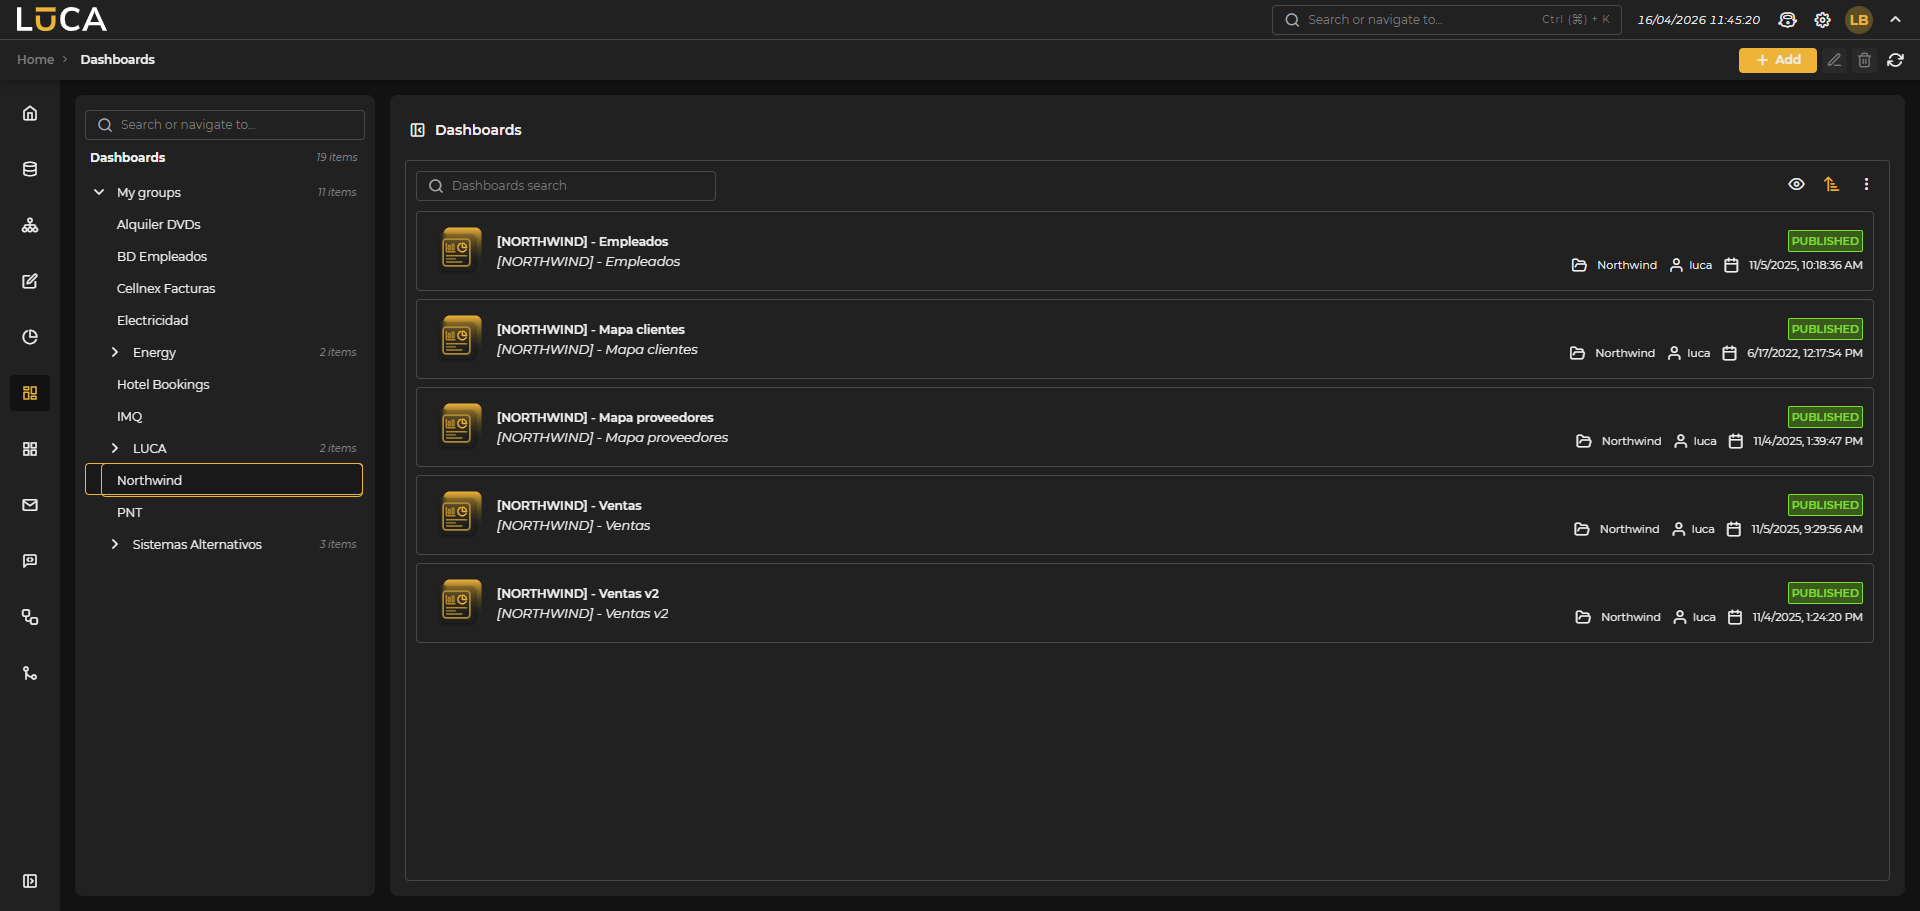 Figure 7.1: Dashboard Management
For more information on the general administration screen, see this section.
Creation and Editing of Dashboards
The dashboard creation view presents the following structure:
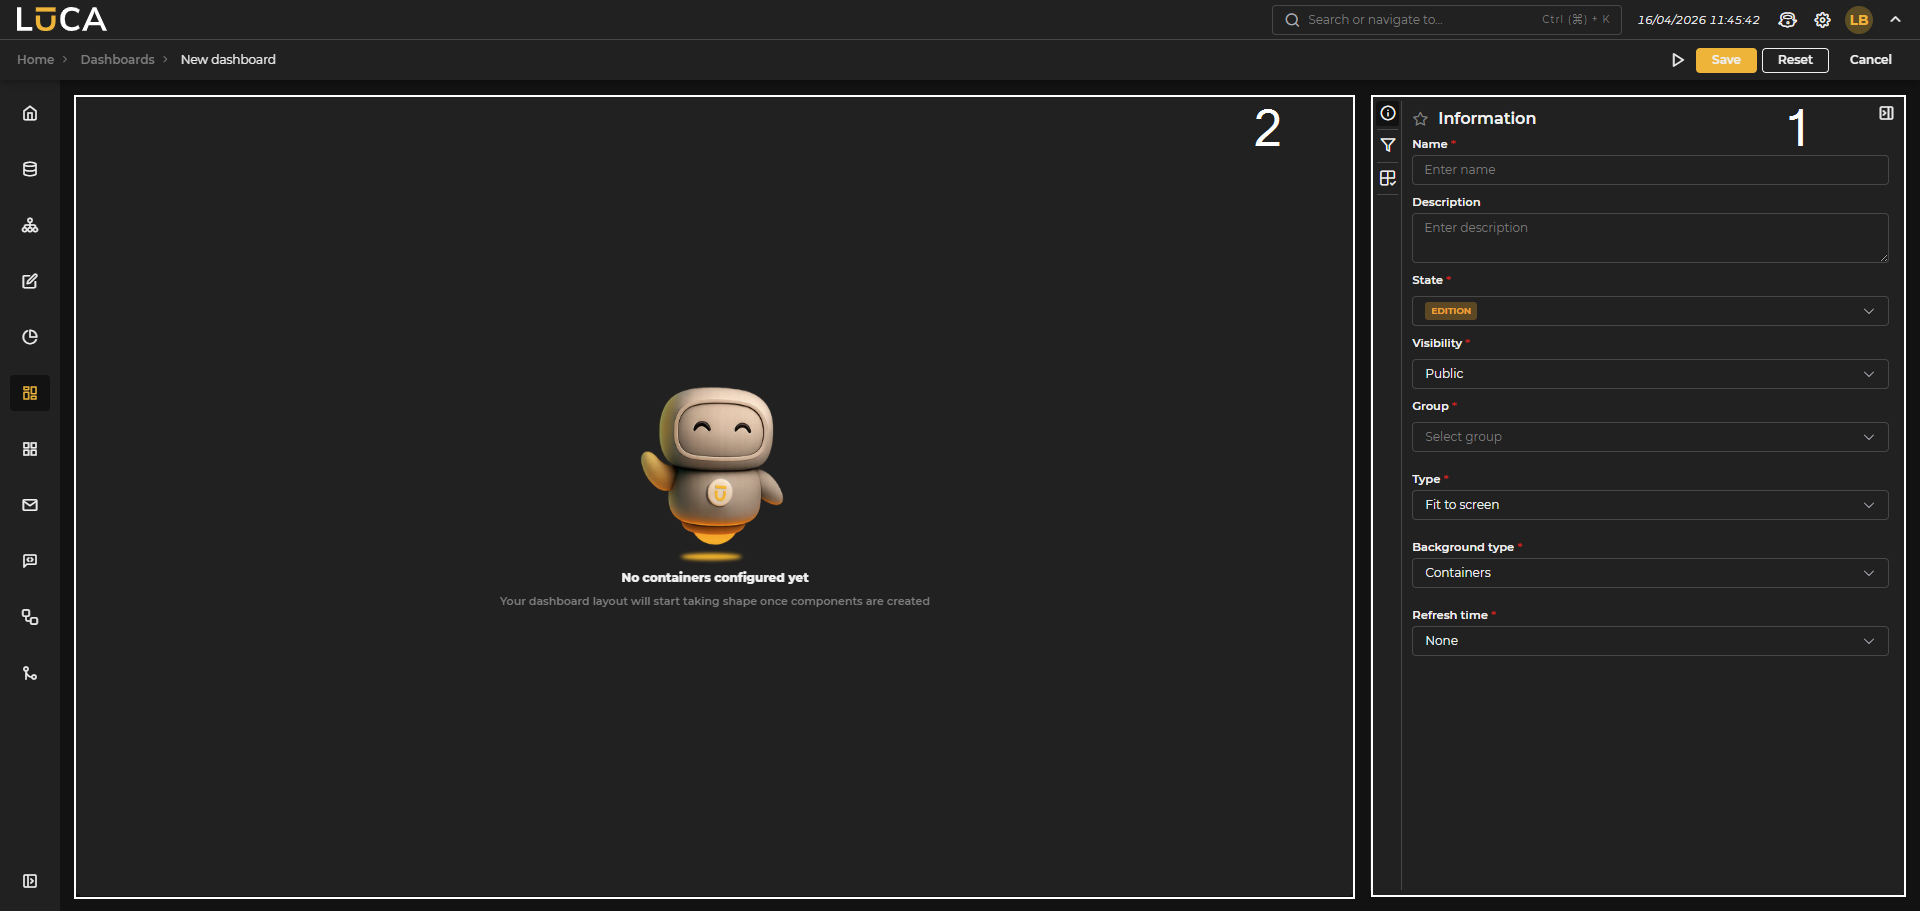 Figure 7.2: Dashboard Creation
Configuration (1): Section that contains three menus to configure the content of the dashboard.
Editor (2): Blank canvas where filters and containers containing graphs and queries are created.
In the configuration section, we find the following buttons:
- Execute: Saves and executes the query.
- Save: Saves the query information.
- Reset: Clears the data entered in the form.
- Cancel: Closes the editor and returns to the queries administration screen.
Information
This configuration is shared among all LUCA elements. For more information, go to Information tab.
In addition to the common properties, the following features can be configured:
Type
-
Fit to screen: no scroll, and all components are shown adjusted to the browser size.
-
Infinite scroll: allows adding as many items as desired, creating a scroll to view all configured elements. Background type
-
Uniform: the dashboard background is uniform, and no distinction is made between different containers.
-
Containers: each container has its own frame and separation between them. Refresh time: Interval at which the dashboard data is updated automatically.
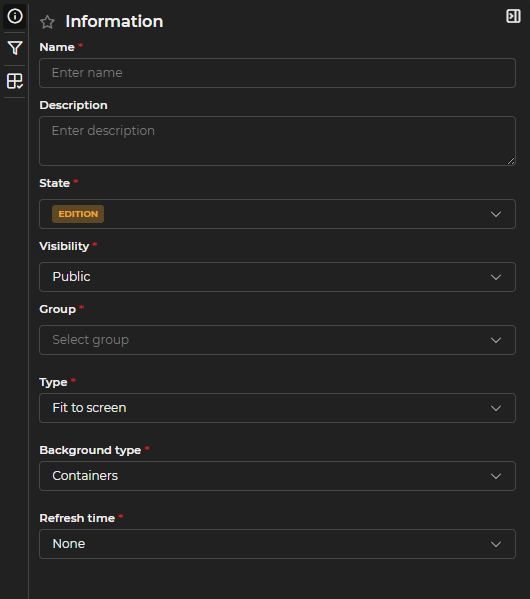
Figure 7.3: Information Form
Filters
Filters allow the entry of input values to filter one or more elements configured in the dashboard. To create one, click the Add button in the configuration and fill out the form. A title for the filter can be configured and shown or hidden using the corresponding selector.
As many variables as desired can be configured, establishing for each one:
- Description: name of the variable.
- Combo: indicates if the variable is a combo. If checked, the query must be selected to load the data or specify fixed values.
- Multi-selection: allows selecting multiple values in the combo.
- Optional: indicates whether the variable is mandatory or not.
- Visible: indicates whether the variable should be visible.
Like the variables in the queries, these also have an advanced configuration that allows for more precise adjustment of the filter's behavior.
Once configured, click Add variable.
Finally, select the environments to be displayed in the filter and click Add filter. The filter will appear in the editor, where its position and size can be modified.
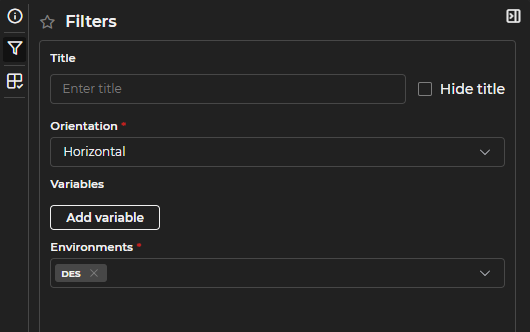
Figure 7.4: Creating a Filter
Containers
Containers are the elements that display data in a dashboard. By clicking the Add button, a contextual menu appears that allows selecting the type of container to be created.
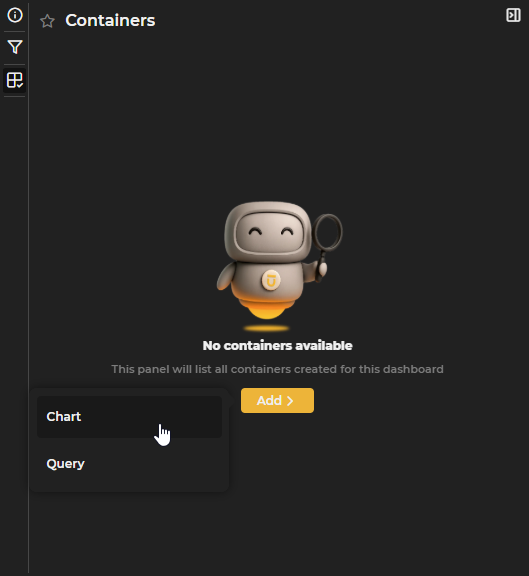
Figure 7.5: Creating a Container
Chart: A container that includes an already created chart. When creating it, you can optionally configure a Title and Caption, each with its own color selector. You must also choose which of the existing charts you want to add and one of the filters configured for it. Filters created in the dashboard itself can also be utilized by linking the chart variables with those of the filter in the Dashboard Filters section. Finally, click Add container to add it to the editor and modify its position and size.
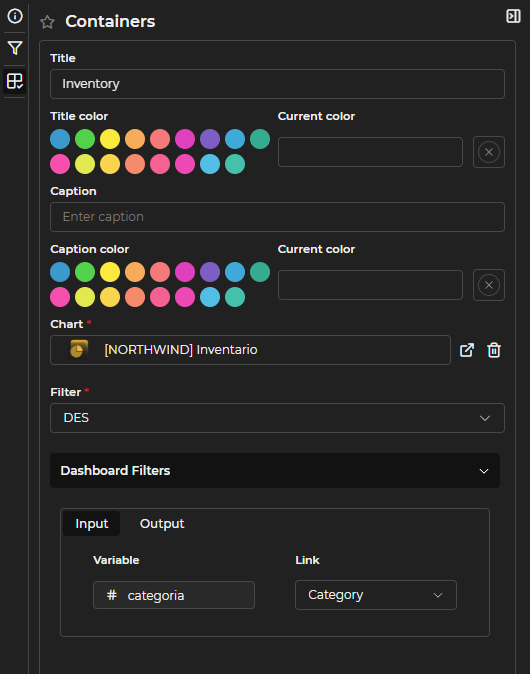
Figure 7.6: Creating a Chart Type Container
Query: A container that displays an already created query. When creating it, you can optionally configure a Title and Caption, each with its own color selector. You must also select the query, set the page size, and whether to show pagination or not. If the query has input variables, a default value can be assigned to these variables or linked to variables from a filter already created in the dashboard. Once configured, click Add container to add it to the editor.
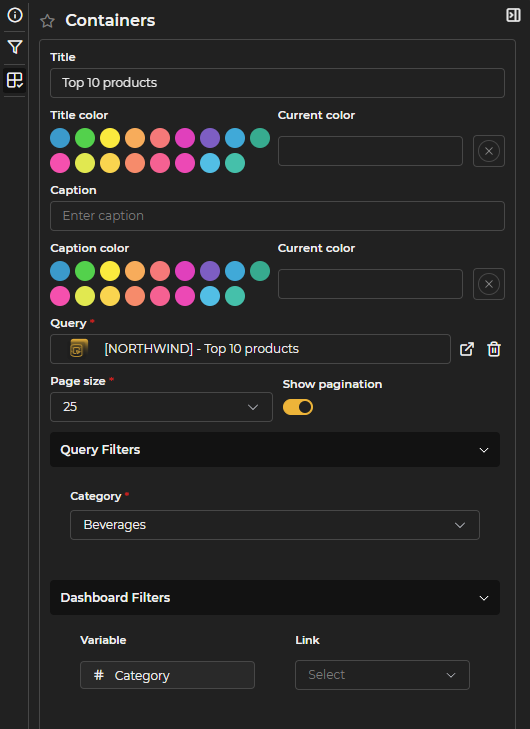
Figure 7.7: Creating a Query Type Container
A filter or container can be deleted by clicking the 'x' located to the right of its name.
Executing a Dashboard
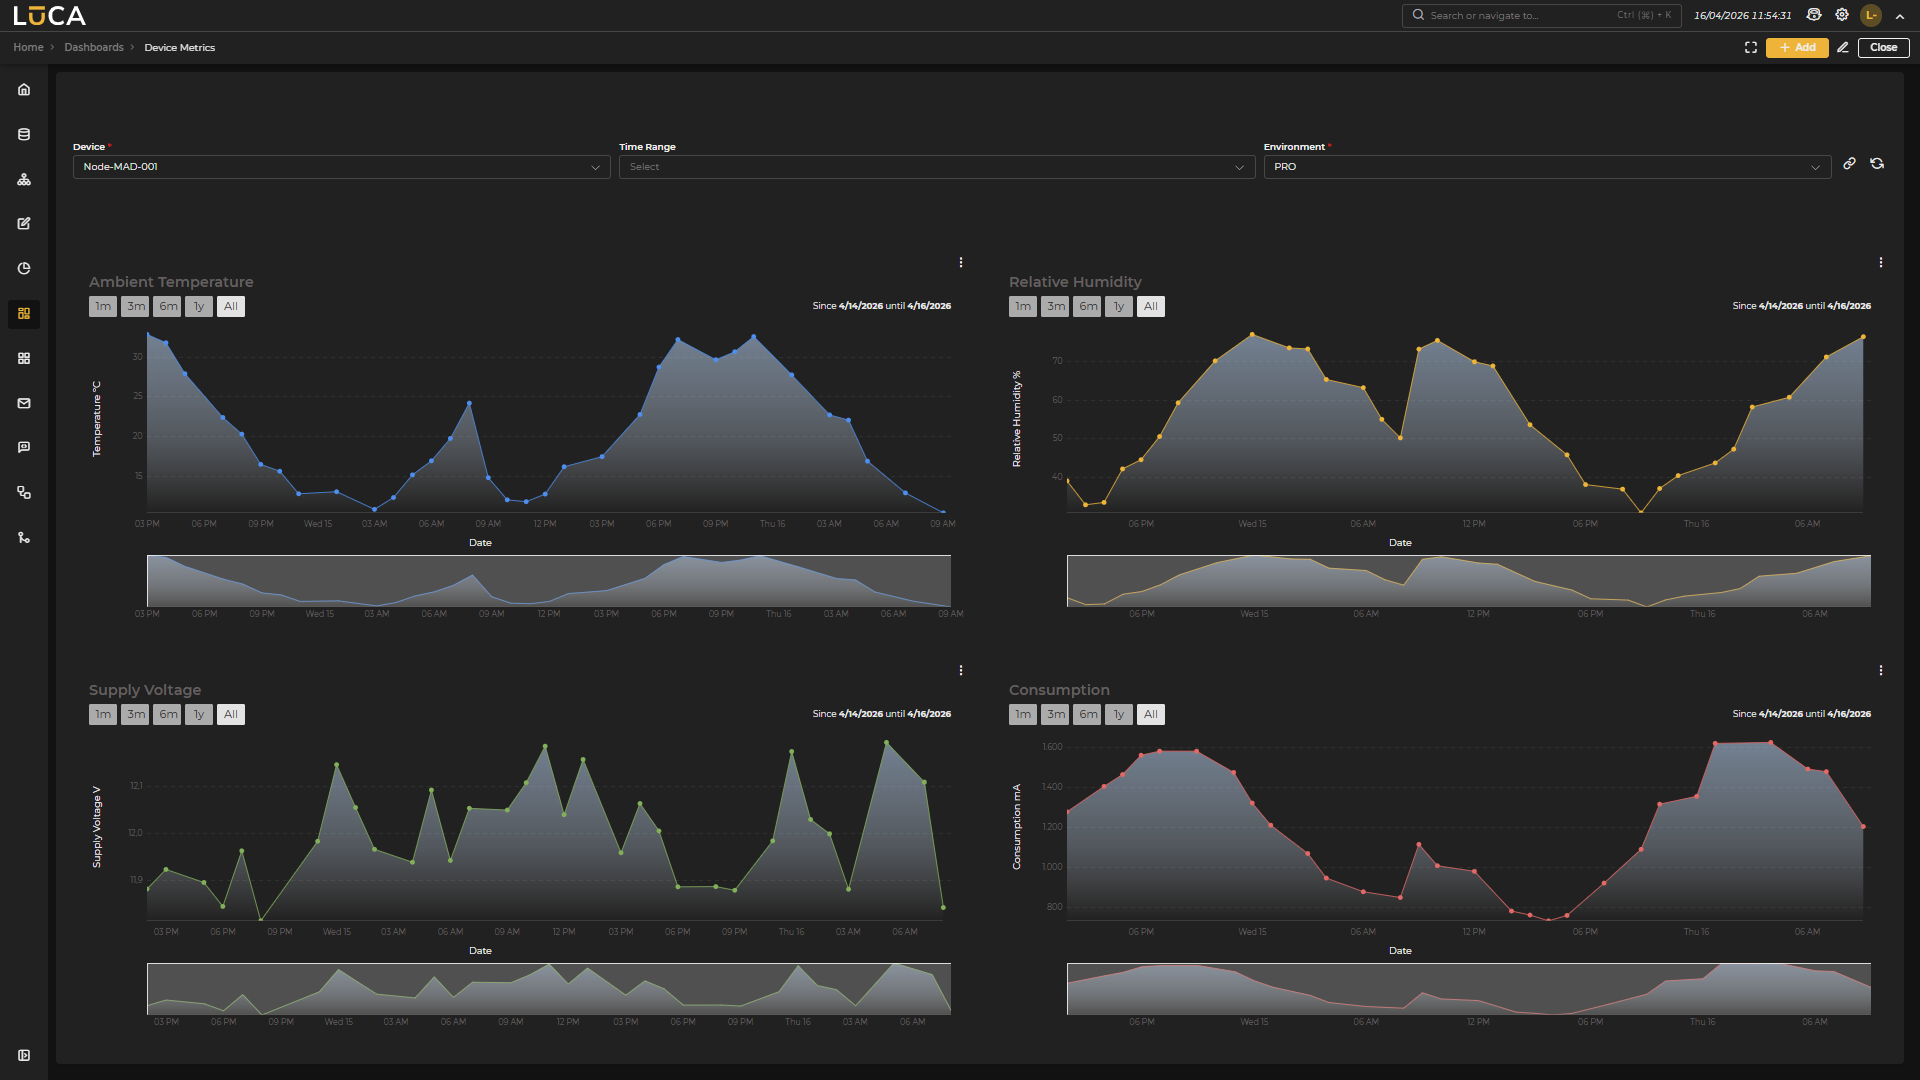 Figure 7.8: Executing Dashboards
On the execution screen, you can interact with the filters and visualize information in the various graphs and queries.
All configured queries and graphs have a vertical three-dot button in the upper right corner of each container that allows reloading the graph to update the data, exporting data to CSV or Excel, generating a PNG, generating a link to share the container, or opening the editing window if permissions are available.
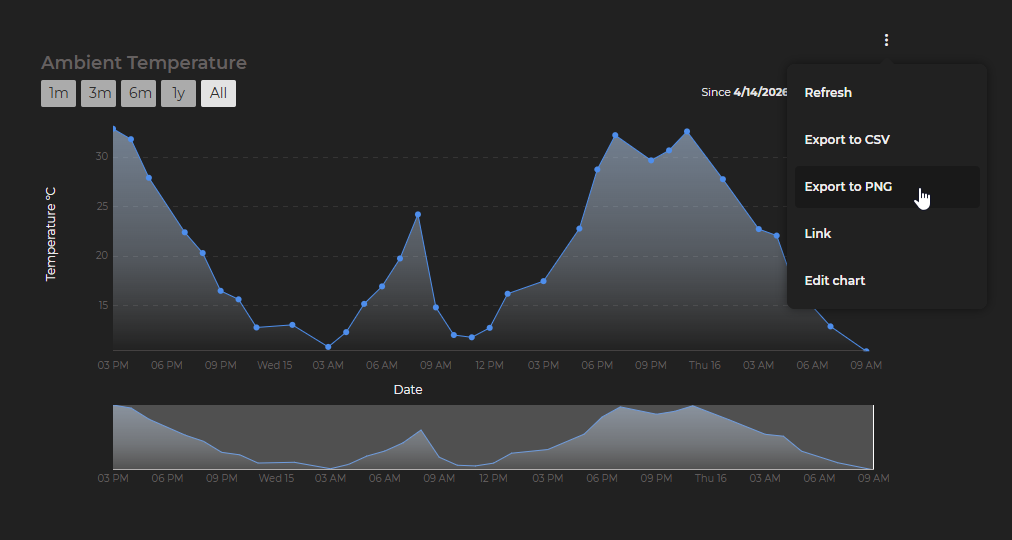 Figure 7.9: Container Options
Below the filters are the execute button and the generate a link button for direct access to the dashboard execution for sharing. If the dashboard does not have configured filters, the link must be generated from the administration screen: select the dashboard and click the menu button (three vertical dots), which offers among other options the option to generate a link.